
Editor's note: Michael S. Garver is a market research consultant and professor of marketing at Central Michigan University.
More than 30 years ago, Peterson and Wilson (1992) authored an important article that called into question common measurement practices associated with customer satisfaction studies. They put forth results suggesting that customer satisfaction data have a strong positive bias that is negatively skewed and that customer satisfaction levels may thus be inflated and overstate the satisfaction of a customer base. Furthermore, they argued that the most common response is often the top scale point and that as a result these scales display little variation.
It is troubling that many of the same customer satisfaction scales that were employed in the 1990s are still prevalent today and the resulting customer satisfaction data is still positively biased and negatively skewed. Garver and Williams (2020) state, “Future research needs to examine measurement error and scale use bias associated with customer satisfaction data and researchers need to develop new scales and approaches to overcome these problems.”
The purpose of this article is to examine two new measurement scales for CX research and to embed these new scales into a more comprehensive measurement system for CX researchers.
Insightful journey
During a CX research project where we implemented the Net Promoter question, we decided to follow up with customers who were classified as Promoters and Detractors to better understand their perspective. This was an insightful journey and the author continued this practice over a long period of time with customers in a variety of different product and service contexts, examining our own CX surveys as well as those created by other researchers to learn how customers use CX measurement scales to rate products and services.
The first thing we learned was that customers use measurement scales differently. While the majority of customers use the Net Promoter question according to its classification rules, many do not. For example, there were hard-grading customers who supplied a 7 response that would recommend the product. In contrast, there were easy-grading customers who gave a 9 response but only thought the product was good or average. An overarching theme was grade inflation, where a strong positive bias was present in many customer ratings. On a side note, there was a group of customers who did not recommend products or services no matter their level of satisfaction.
In our discussions, there were many customers who mentioned their ratings as a comparison to a standard of excellence. While customer satisfaction was founded on this notion, the most common standard was different than what is specified in the academic literature. Only a small percentage of customers discussed the standard as expectations or needs and no one ever discussed ideal as the standard of comparison.
Instead, the comparison standard employed by many customers was a historical “best ever” experience with a product or service. With our customers, comparing to expectations and the ideal was too abstract, whereas the “best ever” product was concrete and could be recalled in detail. This is NOT a “best other product” comparison on the same CX survey but instead a historical “best ever” product or service from their experience.
For example, a Promoter once commented that that he supplied a 10 rating because his emergency room visit was the “best ever” experience in a hospital setting. Another Promoter commented that he supplied a 10 rating because his truck was the best vehicle he had ever owned. A student gave a professor a top rating and commented that she was the “best ever” professor she had experienced over her college career. This same student later discussed other professors who received a top rating and were “one of the best ever” professors she had taken courses from.
In addition to extreme answer choices (best ever or worst ever), customers often made comparisons to the average product or service. When customers gave lower ratings, they often compared those products to average, above average or below average products in the marketplace.
The positive bias in ratings was real for many respondents. While many supplied a 9 or 10 overall rating, not all of those products or services were “best ever” or “one of the best ever.” In fact, many products and services that received a 9 or 10 rating were just good or above average. In short, customers classified as Promoters were not all Promoters but instead a mixed bag of “best ever,” good or above average products and services. The main question at this point became imperative: How do we better measure the overall customer experience?
Simply not relevant
Customers also discussed that many surveys asked too many questions that were simply not relevant to the customer experience. One customer said, “Instead of asking what is important to you, just ask about what is important to me!” For example, a customer had a “best ever” experience in a hospital emergency room because of the skill and compassion displayed by the nursing staff and doctor, along with a short wait time. He commented that when he took the hospital’s CX survey, it asked him to rate 20-plus attributes that he did not notice or care about. Frustrated that the relevant attributes were overshadowed by the irrelevant ones, he never finished the survey.
Many customers wanted to focus on the attributes that needed fixing. In a similar vein, others wanted to call attention to the strengths and weaknesses of a product or service, highlighting their compliments and complaints. These customers wanted to streamline the process and provide feedback only on what was relevant to them in improving the product or service. Some customers wanted to give improvement suggestions instead of ratings.
Based on our discussions with respondents and examining the academic literature, we propose two new CX scales which we call the best ever scale and the stated improvement scale.
To make surveys easy to understand, researchers commonly use consistent question formats, a consistent number of scale points and consistent verbal scale anchors for measuring all CX attributes (Mackenzie and Podzakoff 2012). Researchers typically use verbal anchors such as, 1 means very dissatisfied to 10 means very satisfied, or 1 means poor to 10 means excellent. This consistency (scale points and verbal anchors) can lead to satisficing answers, where survey respondents may go into a passive mind-set and give responses with limited thought. Based on this finding, we have changed the number of scale points, anchors and the direction of our new scales to jolt survey respondents out their stupors.
Best ever scale
To overcome satisficing answers, the best ever scale utilizes a nine-point scale with labels only and no numbers. The question stem is similar but the answer choices are completely new. After testing many different answer choices, we decided on the scale shown in Figure 1.
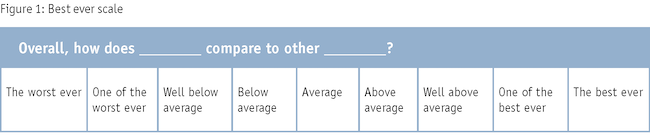
The best ever scale is similar to previous scales in that the answer choices embed a comparison standard (exceeds expectations, very close to the ideal, etc.). However, the best ever scale embeds a historical best ever or worst ever comparison standard into the responses, one that was commonly put forth by customers. In addition to the extreme answer choices, it also embeds a comparison to the average product or service, something commonly discussed by customers.
Stated improvement scale
Amoo and Friedman (2000) found their improvement scale supplied lower ratings (decreased the positive bias) as compared to five other commonly used rating scales. Researchers have proposed improvement scales (Waddell 1999; Amoo and Friedman 2000), yet our stated improvement scale utilizes different response options. After testing a large number of answer choices, including those put forth by Waddell (1999), we decided on a five-point scale utilizing anchors as well as a midpoint, with a reverse ordering. These were all undertaken to limit satisficing responses. Our stated improvement scale has the answer choices shown in Figure 2.
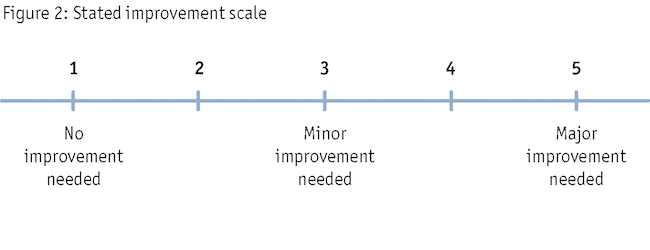 The stated improvement scale has a reverse ordering, meaning that it starts with a positive response (no improvement needed) which is opposite of most other scales (Net Promoter, ACSI, etc.). At first, we were concerned that shifting the order might cause respondent error but after many tests, this has rarely occurred.
To examine these new scales, we statistically compared them to the Net Promoter question and the three American Customer Satisfaction Index questions (ACSI satisfaction, ACSI expectations and ACSI ideal). Given the measurement issues presented earlier, what characteristics would an improved CX scale possess? Consistent with Amoo and Friedman (2000), we believe the following characteristics would represent a better CX scale: lower satisfaction mean scores; fewer top-box responses; and a more normal distribution or a less negatively skewed distribution.
The majority of our tests for the best ever scale and stated improvement scale have been with measuring CX attribute performance, yet we have also collected overall evaluations for these new scales in addition to the Net Promoter question and the three ACSI questions. We collected CX data from a sample of Gen Z in the domain of streaming TV and movie services. After selecting their primary streaming platform (Netflix, Hulu, etc.), we had the respondents provide overall evaluations utilizing six different rating scales for their primary streaming platform (sample size of 105).
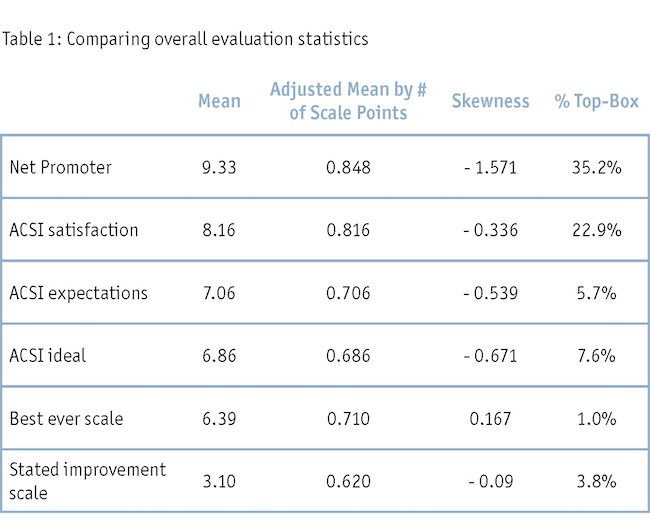
CX measurement scales tend to have a positive bias, thus a scale that produces a lower mean score would be preferred. The mean scores for each scale are in Table 1. Because each scale has a different number of scale points (Net Promoter = 11, ACSI = 10, best ever scale = 9 and stated improvement scale = 5), we need to adjust the mean scores by their respective number of scale points to obtain a more comparable mean score. The stated improvement scale had a significantly lower adjusted mean score (.620) than the rest of the scales, which is consistent with prior research (Amoo and Friedman 2000). The Net Promoter and ACSI satisfaction question have significantly higher adjusted mean scores (.848 and .816). ACSI expectations and ACSI ideal and the best ever scale have similar adjusted mean scores (.706, .686 and .710). The stated improvement scale produces a lower mean score, demonstrating the least amount of positive bias.
CX measurement scales have too many top-box responses, thus a scale that produces a lower percentage of top-box responses would be preferred. The Net Promoter and ACSI satisfaction scales have significantly more top-box responses (35.2% and 22.9%) than the other scales. ACSI expectations and ACSI ideal (5.7% and 7.6%) have significantly lower top-box responses than the Net Promoter and ACSI satisfaction scales. Lower still, the best ever scale (1.0%) and stated improvement scale (3.8%) have very low percentages of top-box responses.
CX measurement scales tend to have negatively skewed distributions, thus a scale that produces a more normal distribution would be preferred. A normal distribution has a skewness of zero. The Net Promoter question has a high level of negative skewness (-1.571). The three ACSI questions have moderate levels of negative skewness (-.336, -.539, -.671), yet well below the Net Promoter question. The stated improvement scale (-.09) and the best ever scale (.167) are much closer to a normal distribution than the other scales. While the stated improvement scale is closest to a normal distribution, the best ever scale produced a slightly positive level of skewness, a rare characteristic for CX measurement scales.
Based on lower mean scores, a lower number of top-box responses and more normal distributions, we conclude the best ever scale and the stated improvement scale perform better than the Net Promoter question and the three ACSI questions. The majority of our tests for the best ever scale and stated improvement scale have been with measuring CX attribute performance and these results are consistent with our findings across numerous studies. While the results are encouraging, more research is needed in a variety of other product and service contexts.
Recommendations
Let’s begin with what we are not recommending. While our tests show that the best ever scale and stated improvement scale outperform the Net Promoter and ACSI questions, we recommend that researchers continue to use these benchmarks. The value of the Net Promoter and ACSI is being able to compare your offering’s performance to industry averages and benchmarks, as well as comparing your performance to both direct and indirect competitors. Additionally, the value of tracking your performance over time cannot be overstated. We recommend adding the best ever scale and stated improvement scale in addition to your current practice to provide additional insight.
Some offerings lend themselves to gather best other-competitor ratings on their CX survey for both overall performance as well as attribute performance. If you can obtain best other-competitor ratings directly in your CX survey, then this represents best practice and the scales may or may not add significant value. However, many offerings do not lend themselves to capture best other-competitor ratings. For example, customers typically only use one computer, phone, automobile, word processor or tax service. In these situations, we recommend utilizing the best ever scale and stated improvement scale for both overall evaluations as well as attribute evaluations.
Comprehensive measurement system
Our recommendation is to implement our newly proposed CX scales into a more comprehensive measurement system in the following manner:
- Utilize the best ever scale and stated improvement scale for overall ratings, in addition to your current overall measurement scales.
- Utilize the best ever scale and stated improvement scale for attribute ratings in addition to your current attribute measurement scales.
- Limit the number of attributes in your CX survey to highly relevant, overall categories.
- For CX attributes, create an attribute index score that is comprised of your current scale as well as the best ever scale and stated improvement scale.
- Conduct key driver analysis with these attribute index scores.
- Implement a stated improvement analysis to complement your inferred improvement analysis (i.e., importance-performance analysis).
Implementing the best ever scale and stated improvement scale for overall and attribute ratings, in addition to your current measurement scales, is straightforward and easy. We suggest placing your current measurement scales before these new scales to minimize order effect bias. Academic researchers have always recommended three measurement items per attribute and this achieves this goal of a more accurate measurement system.
Limiting the number of attributes in your CX survey to highly relevant, overall categories is critical. While many readers will be loath to include more survey questions due to survey fatigue, this issue can be overcome if the attributes are highly relevant and important to survey respondents. Respondents lose motivation when the attributes are not relevant or important and they do not have the experience to answer the questions.
The next step in the process is to create attribute index scores. This can be done by simply adding up the three scores (best ever scale, stated improvement scale and your current scale) for each attribute. To make these index scores more intuitive, we recommend normalizing them to a 100-point scale, similar to the ACSI. To accomplish this, the researcher would create a new variable by adding the three scores for each attribute, then divide this number by the total possible number of scale points minus three. This number would then be multiplied by 100, which results in a 100-point scale for each attribute.
Key driver analysis (statistically inferred importance analysis) would then be conducted with the attribute index scores against a relevant dependent variable. The attribute index score should deliver more variation than single attribute scores, which will deliver more accurate key driver analysis results. We strongly recommend utilizing relative weight analysis for conducting key driver analysis. For more information on relative weight analysis and other best practices with key driver analysis, the interested reader should reference Garver and Williams (2020).
Many CX researchers examine attribute improvement opportunities via importance-performance analysis and we recommend this analysis as well. In addition, we recommend conducting a stated improvement analysis utilizing data from the stated improvement scale. Because this scale specifically asks about the level of improvement needed for each attribute, conducting a stated improvement analysis is an added benefit of this scale and a recommended step. A thorough discussion of this analysis is beyond the scope of this article, yet it can easily be accomplished by examining mean attribute scores in addition to conducting frequency counts for attributes needing minor through major improvement.
Overcome limitations
This research study presented two new measurement scales (best ever scale and the stated improvement scale) to overcome some of the limitations of traditional customer satisfaction measurement scales. Based on lower mean scores, a lower number of top-box responses and more normal distributions, we conclude the best ever scale and the stated improvement scale perform better than the Net Promoter question and the three ACSI questions. More importantly, we argue that these scales should be embedded into a more comprehensive measurement system for CX researchers.